- Rand Index
- Mutual Information
- V-Measure
- Fowlkes-Mallows Score
- Silhouette Coefficient
In the following chapters, we dive into these cluster performance measurements.
Table of Contents
Rand Index
Rand Index Summary
The Rand Index (RI) measures the similarity between the cluster assignments by making pair-wise comparisons. A higher score signifies higher similarity.
– The number of a pair-wise same cluster can be seen as “true positive” (TP)
– The number of a pair-wise wrong cluster can be seen as “true negative” (TN)
The Rand Index always takes on a value between 0 and 1 and a higher index stands for better clustering.
\text = \frac + \text>>
where the total number of possible pairs is calculated by
\text = \fracwhere n is the number of samples in the dataset.
Adjusted Rand Index (ARI)
Because there might be many cases of “true negative” pairs by randomness, the Adjusted Rand Index (ARI) adjusts the RI by discounting a chance normalization term.
When to use the Rand Index?
- If you prefer interpretability: The Rand Index offers a straightforward and accessible measure of performance.
- If you have doubts about the clusters: The Rand Index and Adjusted Rand Index do not impose any preconceived notions on the cluster structure, and can be used with any clustering technique.
- When you need a reference point: The Rand Index has a value range between 0 and 1, and the Adjusted Rand Index range between -1 and 1. Both defined value ranges provide an ideal benchmark for evaluating the results of different clustering algorithms.
When not to use the Rand Index?
- Do not use the Rand Index if you do not have the ground truth labels: RI and ARI are extrinsic measures and require ground truth cluster assignments.
Example of How to Calculate the Rand Index
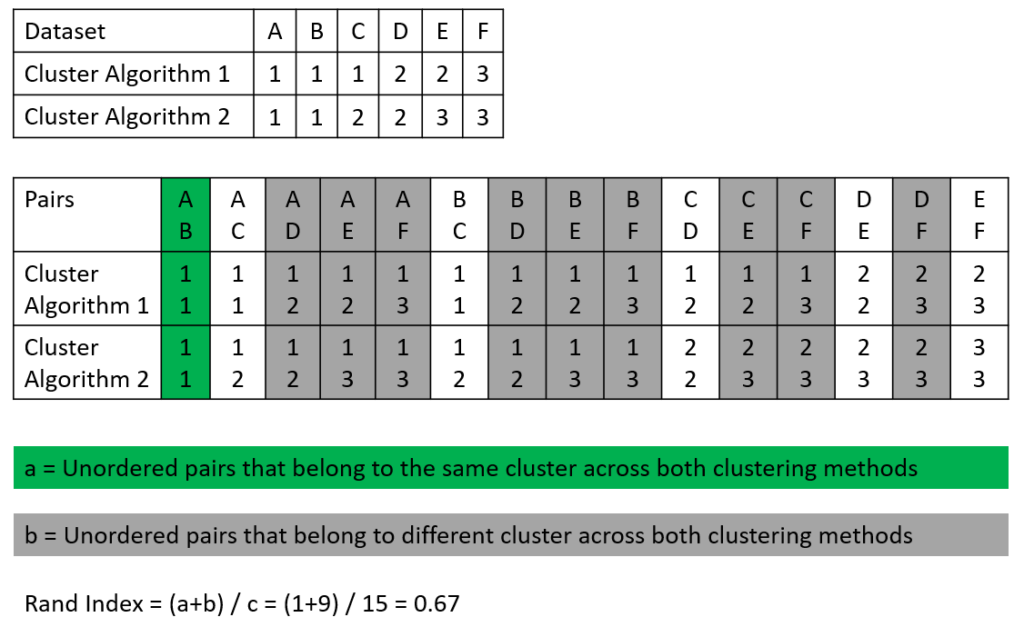
The following picture shows an example of how the Rand Index is calculated. We have a dataset that consists of 6 samples (A-F) and two cluster algorithms that made their prediction for each sample if the sample belongs to clusters 1, 2, or 3 (see the first table in the picture). In the second table, all possible sample pairs are listed with the predicted cluster for algorithms 1 and 2.

To calculate the Rand Index we search for
- Number of the pair-wise same cluster (unordered pairs that belong to the same cluster across both clustering methods), seen in green
- Number of the pair-wise wrong clusters (unordered pairs that belong to different clusters across both clustering methods), seen in gray
Based on the values we found in this example, we can compute the Rand Index:
\text = \frac + \text>> = \frac = 0.67
Calculate the Rand Index in Python
I also proved my example with a short implementation in Python with Google Colab. You see that the Rand Index is equal in the Python implementation as well as in the manual calculation.
from sklearn.metrics import rand_score, adjusted_rand_score labels = [1, 1, 1, 2, 2, 3] labels_pred = [1, 1, 2, 2, 3, 3] RI = rand_score(labels, labels_pred) # Rand Index: 0.6666666666666666 ARI = adjusted_rand_score(labels, labels_pred)Mutual Information
Mutual Information Summary
Mutual Information (MI) measures the agreement between the cluster assignments. A higher score signifies higher similarity.
There are two different variations of Mutual Information:
– Normalized Mutual Information (NMI): MI divided by average cluster entropies.
– Adjusted Mutual Information (AMI): MI adjusted for chance by discounting a chance normalization term.
The Mutual Information always takes on a value between 0 and 1 and a higher index stands for better clustering.
\text = \frac[H(U)+H(V)]>
\text = \frac[H(U)+H(V)]-E[MI]>
- U: class labels
- V: cluster labels
- H: Entropy
When to use Mutual Information?
- You need a reference point for your analysis: MI, NMI, and AMI are bounded between the [0, 1] range. The bounded range makes it easy to compare the scores between different algorithms.
When not to use Mutual Information?
- Do not use the Mutual Information measurement if you do not have the ground truth labels: MI, NMI, and AMI are extrinsic measures and require ground truth cluster assignments.
Example of how to calculate Mutual Information
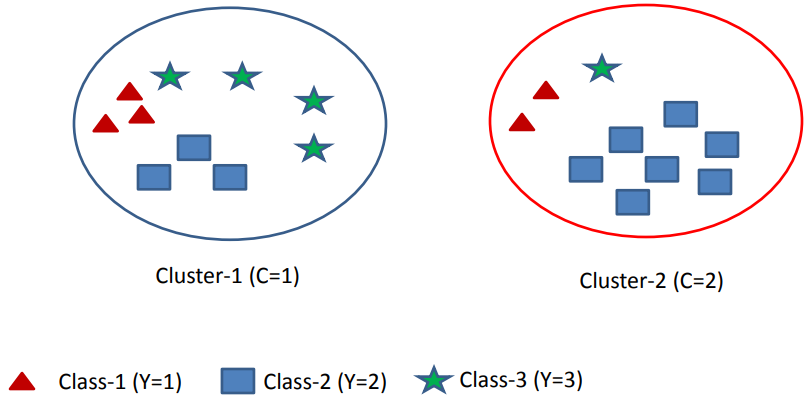
Assume we have m=3 classes and k=2 clusters that you see in the following picture.

Calculate the Entropy of Class Labels
The Entropy of Class Labels is calculated for the entire dataset and therefore independent of the clustering output. Therefore you can calculate the Entropy of Class Labels prior to clustering.
